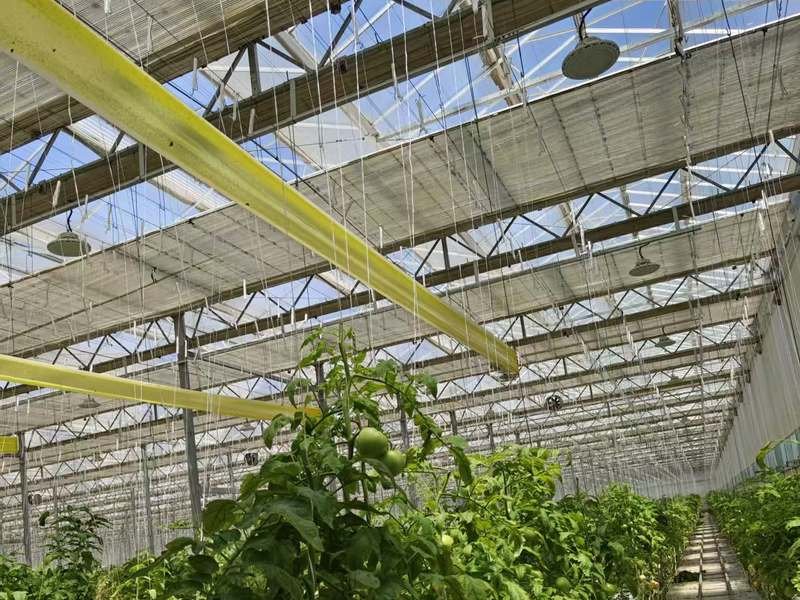
Heating can be one of the largest operating costs for a commercial greenhouse, especially in cold regions. If you are considering a thermal screen, you may be asking how much energy it could save in a year and what that could mean for heating costs. Drawing on commercial greenhouse trials and greenhouse modeling studies, this article explains the potential annual energy savings and why results vary by screen product and greenhouse conditions.
Greenhouse Thermal Screens May Reduce Annual Energy Use by 10–40%
Based on commercial greenhouse trials and greenhouse modeling results, thermal screens may reduce annual energy use by approximately 10–40%. A three-season UK commercial tomato trial found about 13% lower annual fuel use, while a Dutch tomato-greenhouse model estimated about 25–30% savings for a single screen and about 40% in an optimized screen scenario. The two cases below provide more detail on these findings.
Case 1: A three-season commercial tomato trial in the UK
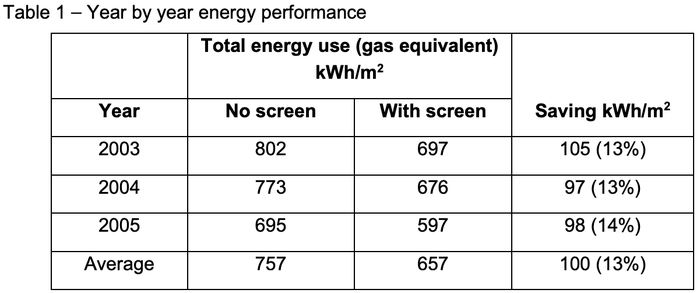
A Horticultural Development Council (HDC) project compared neighboring commercial tomato greenhouse areas in East Yorkshire, England, from 2003 to 2005. One area was fitted with a transparent screen made from fully closed, solid strips, with approximately 12% shading; the comparison area had no screen. Heat use was measured and converted to equivalent gas consumption using an assumed hot-water heating-system efficiency of 85%.
According to the HDC final report, energy savings over the three seasons were 105, 97, and 98 kWh per square meter, respectively—about 13%, 13%, and 14% compared with the unscreened area. The average was about 100 kWh/m² per year, or 13%. AHDB also summarizes this result in its energy management guide.
Case 2: A Dutch tomato greenhouse model
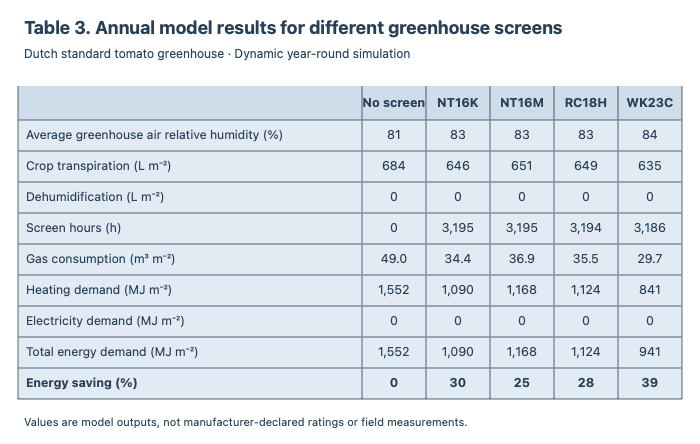
A 2025 study by Wageningen University & Research (WUR) measured the thermal-radiation, air-transport, and humidity-transport properties of four screen materials. The researchers then used a dynamic greenhouse model to estimate year-round energy use for tomato production under Dutch conditions. They compared screened scenarios with a greenhouse without a screen.
In the WUR model results, a single screen typically reduced energy use by about 25–30% in the modeled tomato crop. A scenario using screen properties optimized for low heat and moisture transfer reached about 40%.
Why Can Greenhouse Screen Energy-Saving Rates Differ So Much?
This variation takes two forms.
First, a screen’s published energy-saving rate may differ from the actual annual energy savings achieved in a greenhouse. In the closed-screen product specifications we reviewed, published rates are commonly around 30–70%, depending on the model. For example, the transparent Svensson SLS 10 Ultra Plus used in Case 1 is listed with 43% energy saving in the product specifications. Yet the HDC three-season commercial trial found an average annual fuel-use reduction of about 13%.
Second, even with a thermal screen, annual savings can differ substantially between commercial greenhouses. Case 1 measured about 13% lower annual fuel use, while the WUR model for Case 2 estimated 25–30% savings for a single screen in a Dutch tomato greenhouse and about 40% in an optimized screen-property scenario.
Several factors help explain the difference:
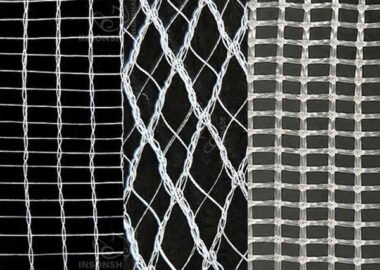
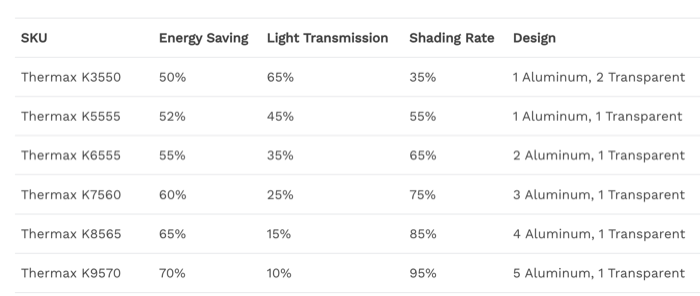
- Screen type and thermal performance: Screens that transfer less heat and air generally retain more warmth, so heating savings tend to increase. Open or more permeable constructions usually retain less heat than well-sealed closed screens. Strip patterns also affect the balance among shading, light transmission, and the energy-saving rate listed for each SKU. The selected Thermax SKU specifications below show how these values vary across different strip designs.

Source: INSONSHADE Thermax product specifications. - Local climate and heating season: Colder weather and a longer heating season generally provide more opportunities to save heating energy. A mild climate or short heating season usually reduces the potential for annual energy savings.

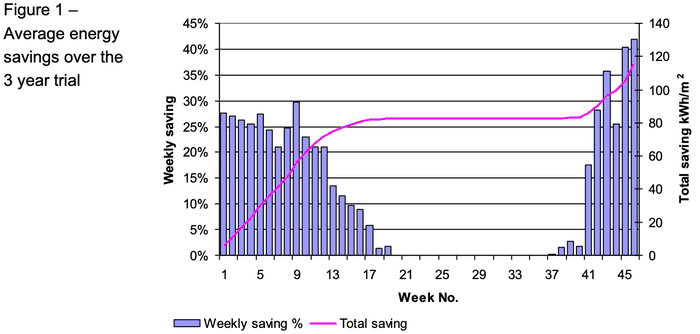
Source: HDC PC 198/198a final report PDF (2006). Figure 1 shows that savings in this trial were concentrated in periods with greater heating demand; weekly savings were close to zero in summer. This suggests that annual savings mainly came from the screen reducing heat loss when heating was needed.
- Greenhouse structure and sealing: A well-sealed greenhouse helps keep the heat retained by the screen inside. Air leaks around the greenhouse or screen allow more heat to escape and can reduce the screen’s contribution.
- Screen use and controls: Keeping the screen closed for longer during periods when heating is needed generally increases savings. Using the screen for less time or setting controls to open it earlier reduces those savings.
- Crop and climate management: Higher temperature targets generally increase heating demand and the potential for energy savings. Ventilation and humidity-control needs can require screen gaps or extra energy, reducing net savings.
Final Thoughts
Commercial trial and modeling results show that thermal screens can reduce greenhouse energy use, although annual savings vary by project. In INSONSHADE’s Kazakhstan greenhouse project, end-user feedback indicates that, when other operating conditions are comparable, fully closed-strip screens can make a substantial contribution to winter energy savings. Based on our product data and project experience, annual energy savings in cold-region greenhouses can often exceed 20%, with greater potential in colder, higher-latitude locations. Exact savings are difficult to calculate because climate, heating hours, greenhouse sealing, screen specifications, and control strategies vary. Treat the 20% figure as a reference, not a guaranteed result.
Sources
- Plackett, C. W. (2006). The use of thermal screens for energy saving and greenhouse climate management in protected edible crop production – performance optimisation. HDC projects PC 198/198a. Final report PDF.
- Adams, S., Langton, A., Plackett, C., Hardy, E., & Swain, J. Energy management in protected cropping. AHDB/NFU Energy. Guide PDF.
- Hemming, S., Mohammadkhani, V., Raaphorst, M., & de Zwart, F. (2025). “Quantifying energy saving by screens – the role of humidity transport.” Acta Horticulturae, 1426, 479–486. Paper PDF.